TouchGraph - Visualize Usage 1.3
Free Version
Publisher Description
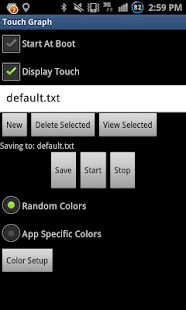
TouchGraph allows you to visualize your Android device usage. It plots out everywhere on the screen you have touched, to an exportable and sharable image. Options include starting at device boot, and displaying the touch. Displaying the touch will visually show all touches as they are done.
Root is NOT required.
In the Free version, the colors are randomized each time the image is viewed.
What are you waiting for? Try it now!
Get the ★Pro Key★ for these additional features:
1. No Ads
2. App specific customization: Change the color depending on the current app opened
For example, draw Facebook touches in blue, Twitter in green, Gmail in Red. The possibilities are endless.
3. Only show touches from specific applications
Coming soon to TouchGraph Pro users:
1. Ability to see the specific time each touch was registered at, as well as the ability to play/pause the touch drawings as they were done over time. (Like a time-lapsed view)
Keywords: iograph, tracking, track usage, plot android usage
About TouchGraph - Visualize Usage
TouchGraph - Visualize Usage is a free app for Android published in the Recreation list of apps, part of Home & Hobby.
The company that develops TouchGraph - Visualize Usage is Bnc. The latest version released by its developer is 1.3. This app was rated by 1 users of our site and has an average rating of 4.0.
To install TouchGraph - Visualize Usage on your Android device, just click the green Continue To App button above to start the installation process. The app is listed on our website since 2012-03-06 and was downloaded 23 times. We have already checked if the download link is safe, however for your own protection we recommend that you scan the downloaded app with your antivirus. Your antivirus may detect the TouchGraph - Visualize Usage as malware as malware if the download link to com.bripts.touchgraph is broken.
How to install TouchGraph - Visualize Usage on your Android device:
- Click on the Continue To App button on our website. This will redirect you to Google Play.
- Once the TouchGraph - Visualize Usage is shown in the Google Play listing of your Android device, you can start its download and installation. Tap on the Install button located below the search bar and to the right of the app icon.
- A pop-up window with the permissions required by TouchGraph - Visualize Usage will be shown. Click on Accept to continue the process.
- TouchGraph - Visualize Usage will be downloaded onto your device, displaying a progress. Once the download completes, the installation will start and you'll get a notification after the installation is finished.
